

The cryptocurrency market saw a notable surge on December 8, 2025, with Aave’s price climbing to $200. Despite prevailing bearish sentiments, bullish investors might drive the price toward $300, supported by trends in decentralized finance (DeFi).
Aave’s Price Surge Amidst Altcoin Rally
Aave has experienced a downtrend for over three months, but there has been a recent uptick. Prices have remarkably improved from the lows of $147 seen on November 21, 2025. On Monday, the token hit $200 before settling at approximately $193.
This rise aligns with a broader recovery of altcoins, where Bitcoin has shown resilience above $90,000 and Ethereum surpassed $3,100. Solana reached $136, and Chainlink surpassed $13. Over the past week, Aave’s gains amounted to 17%, driven by significant transfers of stablecoins and increasing enthusiasm in the DeFi sector.
Aave is proving what stablecoin adoption at scale looks like.
→ $5B in USDC current supply on Ethereum V3
→ +138% USDC growth YTD on Ethereum
→ USYC live in Horizon, Aave’s RWA marketAll figures from Jan ’25 – Dec.
USDC is becoming a collateral layer for the next era of… pic.twitter.com/GkLd6fAyr3
— Circle (@circle) December 5, 2025
On December 5, Aave’s lending pools saw substantial transactions in USDT, indicating a rising demand for borrowing and a boost in liquidity. Analysts view these developments, along with whale activity, as potential catalysts for further gains.
Aave Price Forecasts
Current market outlooks for cryptocurrencies resonate with broader risk asset trends and seasonal patterns. Historically, December has been favorable for investors during the so-called “Santa Claus rallies.” Aave’s recent 17% increase underscores these optimistic projections, albeit it remains early in the month.
Investors are also closely monitoring anticipated interest rate cuts from the Federal Reserve this week. Bullish momentum could push Aave past the $200 mark; however, volatility remains a concern, as support levels could be significantly lower.
Technical indicators suggest a short-term advantage for Aave bulls, as prices hover above critical resistance and support levels at $178. As depicted in the accompanying chart, buyers eclipsed this threshold when Aave reached highs of $385 between May and August 2025.
Yet, declines since the year’s peak have lowered the token’s value below $178, dragging it down to $147 in November. This downturn places Aave in a downward channel.
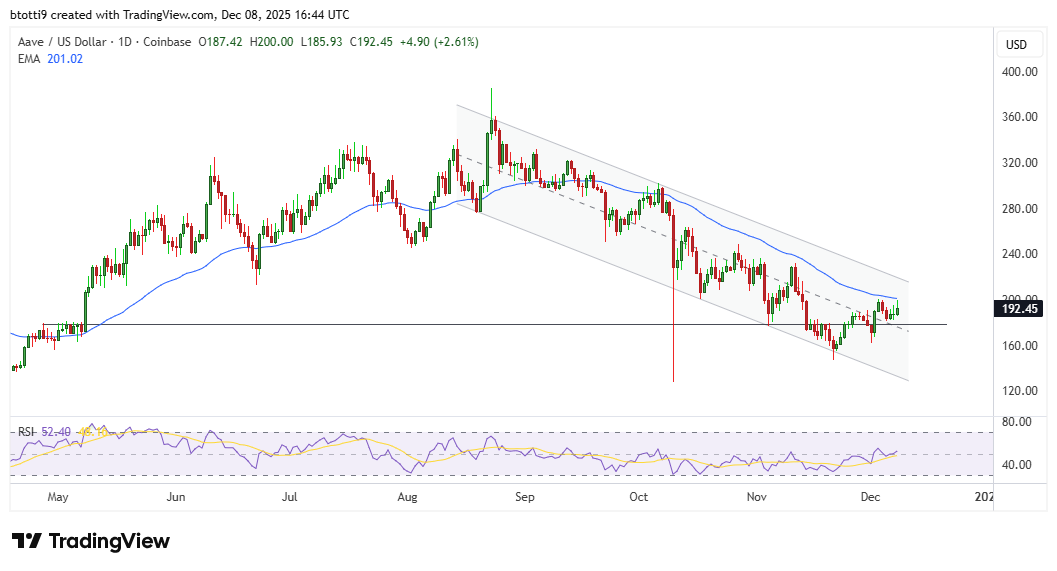
The Relative Strength Index (RSI) currently sits at 52, suggesting room for upward movement without immediately entering overbought territory. Notably, Aave recently moved above its 50-day exponential moving average (EMA), marking a classic bullish confirmation that has historically preceded significant upward movement.
The daily chart for Aave reveals the 50EMA at $201. Potential downside risks, such as Bitcoin dropping below $90,000, could cap gains at this threshold. Nonetheless, bullish traders could aim for key levels of $227 and $320.
