

In a remarkable upturn, the price of Axie Infinity’s token (AXS) has surged over 30% in just one week, leading to a recent 13% increase in value. This recovery follows a challenging period that saw the token reach historical lows not experienced since 2021. Market analysts are scrutinizing whether this bullish momentum can be sustained, especially as some other gaming ecosystem tokens continue to lag behind.
Axie Infinity Surpasses Rivals in Gaming Tokens
On January 16, 2025, early trading data indicated Axie Infinity’s price resting at approximately $1.23. Buoyant buying pressure rapidly propelled the token to peak at $1.30, approaching a weekly resistance level around $1.35 reached just days before.
At the end of December, AXS had plummeted to $0.78, marking its lowest point since a prior breakout that saw it rise from $0.73 to a 2021 peak of $1.18. The recent behaviour, including a recovery back to the $1.00 mark, reflects renewed buying interest in the token.
When comparing Axie Infinity to its peers—such as Immutable, Gala, and The Sandbox—AXS is demonstrating a significant uptick in performance over the last 24 hours and beyond. However, the question remains: can Axie Infinity continue to thrive in a market filled with competitors struggling for traction?
Price Forecast for Axie Infinity
Despite the recent price rebound, AXS is still navigating a precarious situation after previously achieving peaks as high as $165. Currently hovering below $1, the token’s performance may test bears as market conditions shift.
Signs of positive developments within the Axie Infinity ecosystem, including forthcoming gameplay enhancements and economic adjustments, also contribute to a potentially bullish price trajectory. Notably, the introduction of an App Token (bAXS) now allows holders to stake or directly spend this token in Axie Core, which analysts argue could significantly benefit AXS.
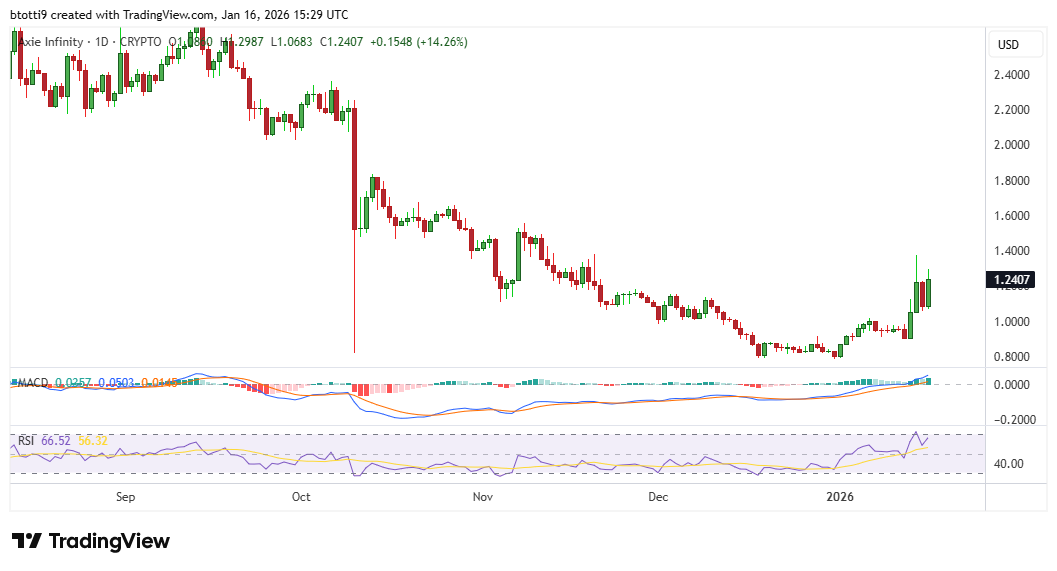
From a technical standpoint, the daily chart indicates a relative strength index (RSI) of 66, suggesting that the bullish trend has room to extend before nearing overbought territory. Additionally, the moving average convergence divergence (MACD) recently marked a bullish crossover with an expanding histogram.
Should the key support level of $1.20 hold, the next resistance levels to watch are anticipated around $1.50 and $2.25. However, a drop below the psychological support threshold could entice sellers, raising the potential for a new multi-year low.
