

Amidst growing market volatility, Solana (SOL) is grappling with significant investor hesitation following a staggering $436 million withdrawal from Pump.fun, a leading meme coin platform. This sudden cash movement raises serious concerns about the stability of the Solana ecosystem and has led to a cautious outlook for the cryptocurrency.
Impact of Pump.fun Withdrawal
The spotlight has turned towards Pump.fun after on-chain data from Lookonchain revealed a major transfer of $436.5 million to the Kraken cryptocurrency exchange. This withdrawal, beginning in mid-October, occurs against a backdrop of increasing uncertainty around the platform’s financial strategy and a noticeable lack of communication from its team.
Investor confidence appears to be dwindling, with the PUMP token plunging over 22% in the past week. The USDC movement has been interpreted as a potential liquidity withdrawal, further exasperating downward pressure across the Solana ecosystem.
Moreover, the USDC exit isn’t an isolated incident. Lookonchain’s reports indicate that Pump.fun has significantly offloaded its Solana (SOL) holdings over recent months, transferring 3.93 million SOL to Kraken and selling 264,373 SOL on-chain. These trends, coupled with a downturn in user engagement on the platform, could lead to decreased network fee revenues for Solana and dampened investor sentiment.
There has also been a marked decline in new tokens created under the Pump.fun’s Mayhem mode, plummeting from over 1,400 to fewer than 20 by November 21, indicating a further erosion of user interest.
Price Recovery Outlook for Solana
Earlier technical analyses had hinted at a potential price rebound for Solana. Indicators suggested that SOL had regained its upward momentum on the four-hour chart, possibly paving the way for a resurgence ahead of other major assets.
Notable trader Cobb pointed to a breakout above short-term resistance levels around $143–145, while GTradeCrypto highlighted a breakout from a symmetrical triangle formation and a potential inverse head and shoulders pattern.
$SOL 1H:
Broke $130 resistance.
Broke EMA Ribbon.Now ready to break the wedge and inverse H&S.
$140 next.Solana pic.twitter.com/nan6tp6CuQ
— Da’ G (@GtradeCrypto) November 23, 2025
This trend hinted at a measured move toward $160, igniting hopes for a more stable recovery. However, despite these bullish indicators, SOL remains trapped in a descending channel that has dictated price movements since mid-September.
SOL/USDT 4H$SOL is still camped at the channel bottom. With top & bottom trendlines converging, volatility is compressing — energy is building for a one-sided move.
A clean reclaim above Demand Zone 3 sets up a run toward Demand Zone 2 / upper TL;
failure to hold → fresh leg… pic.twitter.com/cF4uDKB4VH— CryptoKoon (@Cryptokoon_) November 24, 2025
The emergence of a “death cross” on the daily chart, where the 50-day moving average falls below the 200-day moving average, has intensified caution regarding the technical outlook.
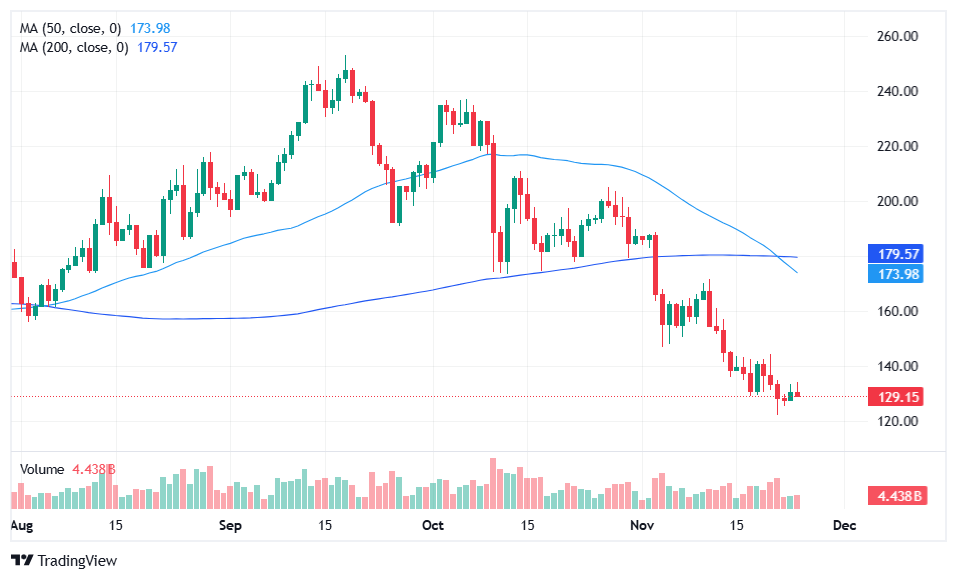
Although recent candlesticks show long lower wicks indicating aggressive buying at support levels between $121 and $123, the market has yet to demonstrate sustainable momentum. A close above $144–146 would be necessary to confirm initial strength, while exceeding $172 would signal a significant trend change. Additionally, the broader technical structure hints at a potential cup and handle formation, with the weekly price range holding steady between $128 and $180. On-chain volume supporting network activity suggests that underlying demand remains despite short-term volatility.
