

The Stellar price is experiencing a significant downturn as altcoins trend downward, mirroring Bitcoin’s struggles. Investors are closely monitoring market conditions, particularly as Bitcoin approaches crucial support levels. A potential drop below $0.20 poses risks for XLM bulls, raising concerns over a more extended bearish phase.
- The Stellar price has sharply declined as altcoins have lost recent gains.
- Broad market conditions, with Bitcoin leaning toward support, are pivotal indicators.
- XLM bulls may face stagnation if the price drops to $0.20 or lower.
The XLM Price Approaches Multi-Month Support
Stellar’s price has identified $0.20 as a multi-month demand zone in recent trading. Initially, the altcoin surged past $0.24 before retreating to a support level around $0.22.
An attempt to recover from these losses was thwarted at approximately $0.23, as the altcoin dipped below $0.21 on January 19, coinciding with Bitcoin’s decline to below $93,000.
Repeated rejections, paired with a marked bearish trend, could deter buyers and lead to a further drop below the critical $0.20 mark.
Bearish sentiment is currently enhanced by technical failings and a waning on-chain confidence. Open interest in derivatives has fallen to $131 million, indicating the accumulation of new short positions, which may pressure targets below $0.20.
Crypto analyst Lark Davis noted, “Gold has just reached a new all-time high of $4,600 and is heading towards $5,000, a major resistance level at $4,618 for the Fibonacci extension.”
However, Davis cautioned, “The faster gold approaches $5,000, the quicker we might see a notable capital rotation from precious metals into Bitcoin.”
Technical Price Outlook Raises Concerns
Bearish trends are underscored by clear failures on the charts, with XLM trading below both its 50-day and 200-day moving averages, currently around $0.227 and $0.324, respectively.
Since October 10, the price has accelerated downward, forming a bearish structure while the RSI has dipped below 50 after a brief stint in the overbought territory.
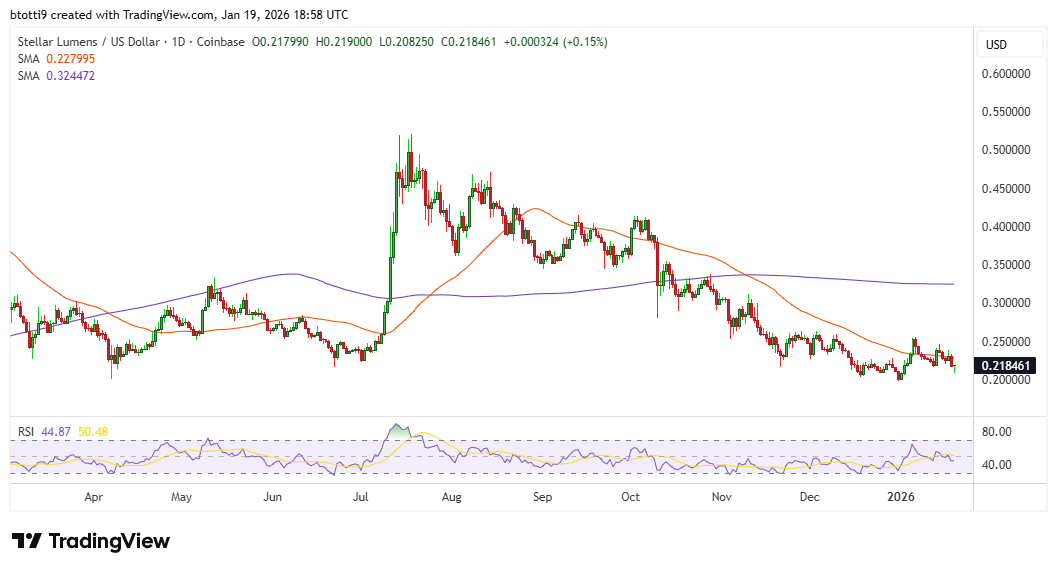
Price rejections from previous support levels indicate that $0.25 and $0.22 have now turned into resistance points. Meanwhile, a daily close below $0.20 could expedite a fall to multi-year lows of $0.18 and $0.14.
Conversely, should Stellar reclaim supply zones of $0.32 and $0.41, a daily close above $0.23 will validate this bullish outlook, paving the way for more decisive trades.
The last time XLM experienced significant bullish momentum, it skyrocketed from $0.10 to over $0.63 in November 2024, and from a low of $0.24 to a peak of $0.52 in July 2025, driven by market enthusiasm surrounding XRP, an altcoin sharing production goals with XLM.
XRP reached highs of $3.42 in July, gaining traction amid major regulatory milestones and the launch of the RLUSD stablecoin.
