


Key Points
- The price of PI has dropped by 1.6% over the past 24 hours, reversing some of the gains made on Thursday.
- This downturn comes despite announcements from Pi Network regarding a new creator event and updates aimed at facilitating the integration of Pi payments.
PI Price Declines Below $0.19 as Downward Trend Resumes
PI, the native token of the Pi Network, has faced a 1.6% decrease in value over the past 24 hours, now trading just above $0.18. This decline comes after the network’s recent announcements intended to invigorate its ecosystem, which include a creator event and plans for integrating Pi payment systems into applications built on the network.
The Pi Network team has indicated that support for Pi payments is currently limited to Test-Pi. Additionally, both new and non-migrated Pioneers can deploy app iterations by viewing advertisements instead of paying fees. This change aims to reduce the financial burden associated with creating Pi-based applications.
Despite the recent price drop, retail demand remains strong. Data from PiScan reveals that users have withdrawn 1.17 million PI tokens from centralized exchanges (CEX) in the last 48 hours. Such withdrawals from CEX may alleviate selling pressure as tokens shift to long-term wallets.
Continued Bearish Sentiment for PI
The four-hour PI/USDT chart indicates a bearish trend, having lost 1.6% of its value in the past day. PI has failed to maintain momentum above the resistance-turned-support level at $0.1919, marked by the low recorded on October 11.
At the time of publication, PI trades at $0.1839. Should selling persist, PI may revisit the lows of October 10 and January 19, priced at $0.1533 and $0.1502, respectively.
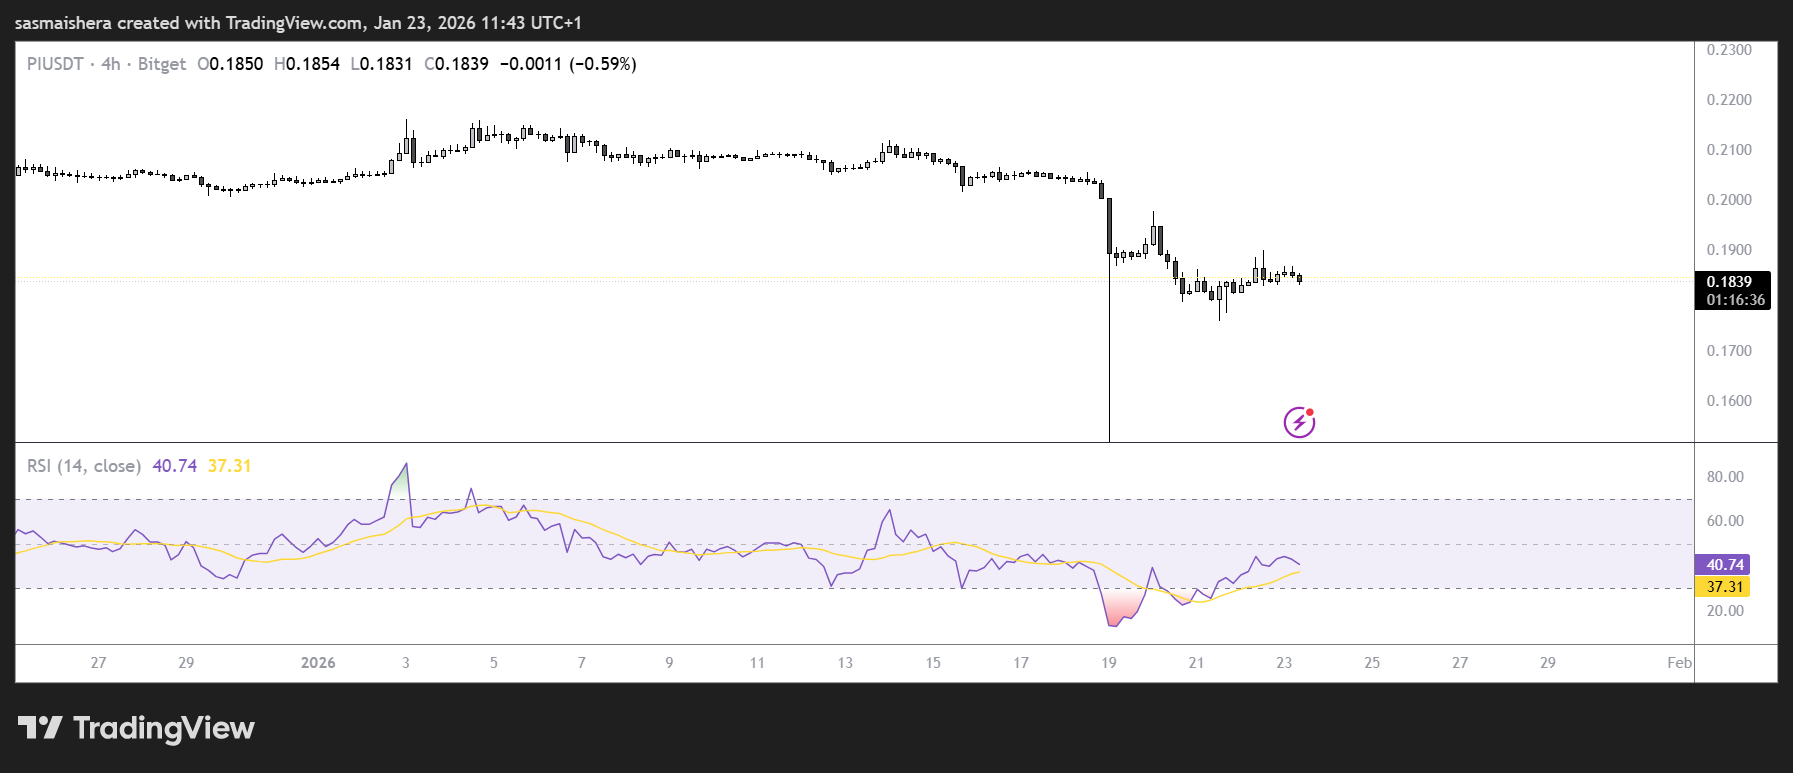
Technical indicators on the four-hour chart reinforce the bearish narrative. The relative strength index (RSI) stands at 40, below the neutral mark of 50, while the moving average convergence divergence (MACD) is diverging beneath its signal line.
Nevertheless, if bullish momentum manages to regain control and PI closes its daily candle above $0.1919, it could extend the rally, targeting a potential peak at $0.2177 set on December 19.
